


Review Job Market Trends in Your Area
Overview
The Review the Job Market tab under How We Can Help You displays occupation metrics and information, such as job demand, salary expectations, hiring employers, and more. Select any of the available links to view a snapshot of Labor Market Information and quickly gain insights into your local job market.

Review the Job Market (table display option)
Where to Find This Feature
You must be logged in using a registered account to use this feature.
-
Left navigation menu > My Individual Workspace > How We Can Help You > Review the Job Market
-
My Dashboard > How We Can Help You > Review the Job Market tab
About Review the Job Market
Use this feature to explore job market information across several categories and in multiple display formats. You can control what information is presented and how it appears — as a map, graph, or table.

Job Market Information Display Options
The information category presented initially is Hot job locations. To select another information category, use the "Helpful links to review your current job market..." at the bottom of the page. You can also select the Next button under the links to advance to the next information category in the list. The display refreshes to show the selected information.
 Information Categories
This table describes the information categories under 'Helpful links to review your current job market.' These links update the page display without sending you to a new page:
|
Select... |
To View |
|---|---|
|
Hot job locations |
The number of job openings advertised online by county. |
|
About your competition |
The number of potential candidates in the workforce system for each job opening advertised online.
|
| Review job requirements |
The job requirements for the selected occupation. |
| Compare your salary expectations | Wage statistics for entry level, mean, and experienced workers in your occupation. |
| Employers that are hiring | Employers with the highest number of openings advertised online for the selected occupation and area. |
| Local labor market for your occupation | Page link to the Occupational Profile for your occupation, providing information on job duties, wages, available jobs, and more. |
| Local labor market profile | Page link to the Area Profile for your local labor market, providing information about a selected geographical area—including wages, unemployment rates, and employers with the highest number of job openings. |
| FAQs and answers | Page link to the Labor Market Facts page with answers to a wide variety of commonly asked labor market questions. |
Case Study: Hot Job Locations
This case study demonstrates how the Hot Job Locations view helps users with different local job markets—low, moderate, and high demand—identify opportunities and make informed decisions by examining how three different users interpret the map and related job market data.
Researching the Job Market
Three users are researching the job market for Restaurant Cooks in Florida. Each lives in a different county with a very different number of job openings:
-
User 1 lives in a county with few openings.
-
User 2 lives in a county with a moderate number of openings.
-
User 3 lives in a county that is a hotspot for job openings.
From the initial map display, all three users can immediately compare counties. The color-coded map makes it easy to spot which areas have the highest number of openings.
Interpreting the Map
-
User 1, from the low-demand county, quickly identifies several nearby counties with better job prospects and potential relocation opportunities.
-
User 2 sees steady demand locally, but notices that a neighboring county offers even stronger numbers—helpful if they’re open to a longer commute.
-
User 3 already lives in one of the top counties for job opportunities.
Digging Deeper: Candidate Competition
Below the map, all three users can select the About your competition link. This view shows the number of potential candidates per job opening. At a glance, they see that:
-
Counties with high job openings generally show lower competition.
-
User 1’s county not only has fewer openings but also more job seekers, indicating a challenging local job market. This insight suggests relocation may be worth considering.
Viewing Job Details
Now that they have identified where the desirable job markets are, the users select the Show Display Options link, and access the Display drop-down list. Selecting the Tableoption presents detailed information, including links to Job Openings for a selected area.
Display Options
Some information categories include a Show Display Options link, which provides the option of switching the display option between tables, graphs and maps. This is done using the Display drop-down list that refreshes the page when you change between selections. Read on for more details about these options:
Table Display
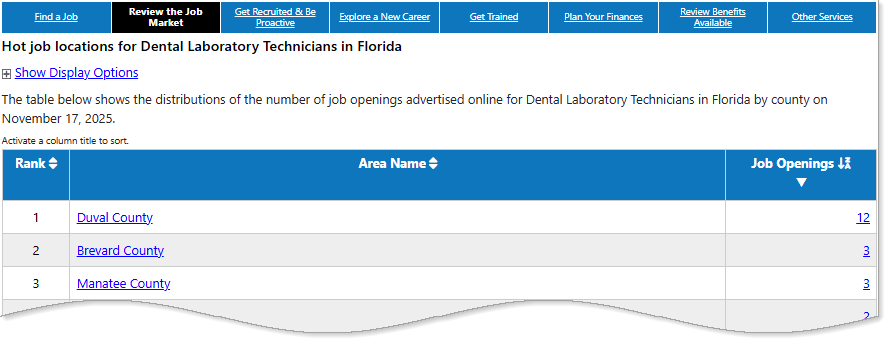
Review the Job Market (table display option)
To view job openings, choose the table display option, which ranks the number of job openings by county. The job openings numbers are links that send you to the current listings for the selected area. View the Area Profile for any of the areas in the list by selecting one of the [area name] links.
Graph Display
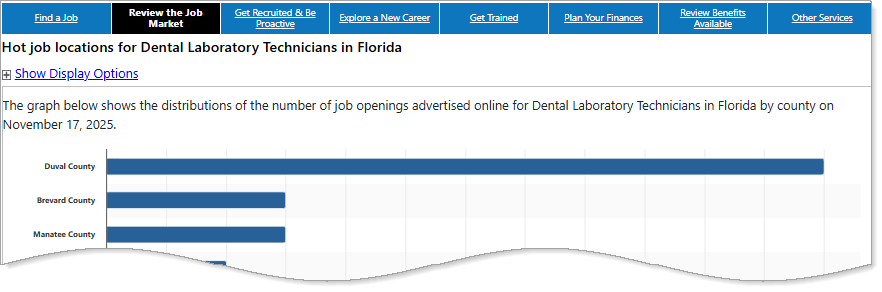
Review the Job Market (graph display option)
The graph display option provides a visualization of the selected information category, ranked by county.
-
Hover over any of the bars in the bar charts to display more information.
-
Options are available to print or export the graph as an image file to JPEG, PNG, SVG or PDF formats. Icons for printing and exporting are located at the bottom of the graph.
-
Change the color by selecting the Graph Color selection from the drop-down list, located at the bottom of the graph.
Map Display
Similarly, the map display option offers a visualization of the selected information category, by county.
-
Use the map legend at the bottom to refer to the color scheme key, or hover your mouse over a county to display more information.
-
Options are available to print or export the map as an image file to JPEG, PNG, SVG or PDF formats. Icons for printing and exporting are located at the bottom of the map.
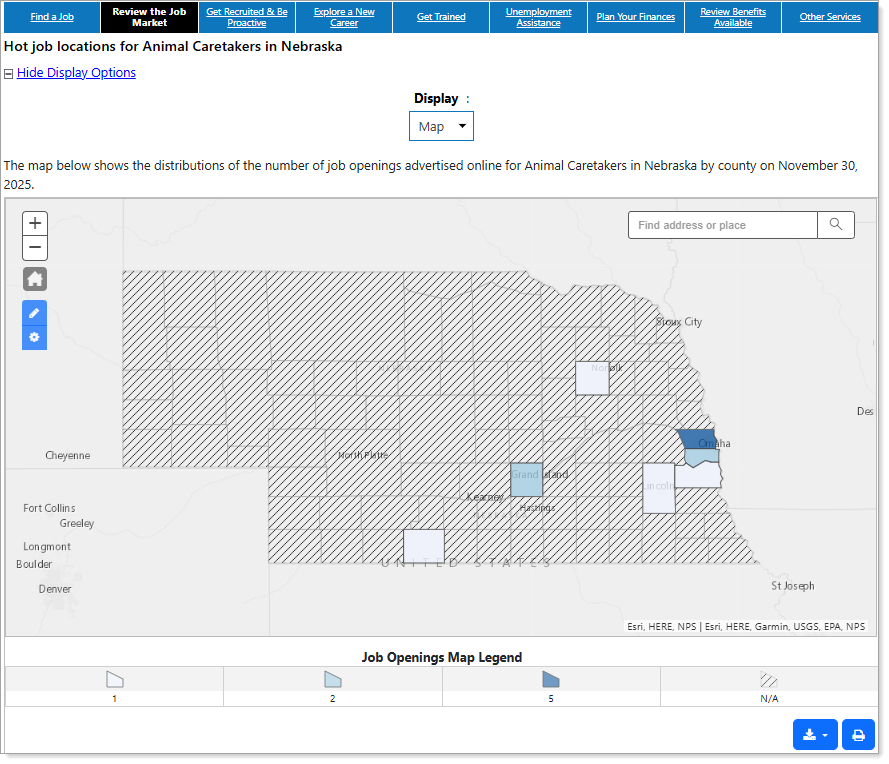
Review the Job Market (map display option)
With the Map display option, use the built-in controls to explore and customize your view. Hover over the top left corner of the map to display the controls:
|
Control Option |
What It Does |
|---|---|
|
Zoom |
Use the Zoom control in the top-left corner of the map or double-click an area to zoom inTo position the map, you can drag it using your mouse, but only in the part of the map that is outside the state border. |
|
Reset (Home Icon) |
Returns the map to its original position and zoom level. |
| Annotation Tools |
Select to draw shapes or add labels for use in printed or exported versions. Hover over each tool to see its function. Annotation Tools
|
| Map Options |
Use the Map Options buttons to add or remove an information layer to overlay on the map. Selected layers appear on the map export or print output. Map Options
|
| Sends the map to the printer. If your map contains an overlay or annotations, you will see these printed out as well. The print icon is at the bottom, apart from the zoom control. | |
| Export | Exports the map as an image file to JPEG, PNG, SVG or PDF formats. If your map contains an overlay or annotations, those will also export. The export icon is at the bottom, apart from the zoom control. |
| Search | Search by city, or street address, to zoom directly into the map. As you type, the system suggests matches for you to select. Find the search feature at the top right. |
| Map Legend | Provides a key to the color scheme, which allows you to interpret the map information at a glance. You can also hover over a county to display more information. |